AI-driven observability platforms with Toto 2.0
Datadog recently released Toto 2.0 (Time Series Optimized Transformer for Observability) as a foundation model for time-series forecasting, specifically optimized for observability data such as:
infrastructure metrics,
application telemetry,
monitoring signals,
cloud system performance,
logs/metrics/traces patterns.
In a nutshell, it’s like a “GPT-style foundation model” for machine telemetry and operational metrics over time rather than text. It can be used to predict abnormal application or infrastructure behavior before incidents occur.
Why is it so important?
Modern distributed systems generate enormous amounts of time-series data, including:
CPU usage
Memory consumption
Request latency
API error rates
Kubernetes pod metrics
Network traffic
Database throughput
Cloud infrastructure telemetry
Traditional forecasting systems often:
Require task-specific training
Struggle with noisy telemetry
Fail on sparse or irregular signals
Do not generalize well across services
One of the main pain points for teams is fine-tuning or training ML models on task-specific datasets. Fine-tuning or training a model from scratch is both time-consuming and expensive. Not every company or team can afford the required resources and infrastructure.

Unfortunately, I have seen several teams attempt to use general-purpose LLMs to predict abnormal behavior in systems and infrastructure.
Toto was designed to act as a general-purpose forecasting engine for the observability signals mentioned earlier. Because of this, I decided to take a closer look at the foundation model and develop a simple application to test its features.
According to sources from Datadog, the Toto 2.0 model was trained on more than 1 trillion time-series data points, with approximately 75% of the training data coming from real observability telemetry collected by the company. As a result, Toto 2.0 can be considered a large pre-trained transformer model for multivariate temporal data.
Architecture overview.
From an architectural perspective, Toto is based on a decoder-only Transformer architecture. It also incorporates specialized attention mechanisms designed for multivariate telemetry data. By borrowing concepts from both Large Language Models (LLMs) and Vision Transformers, Toto can efficiently process massive telemetry streams and perform scalable forecasting.
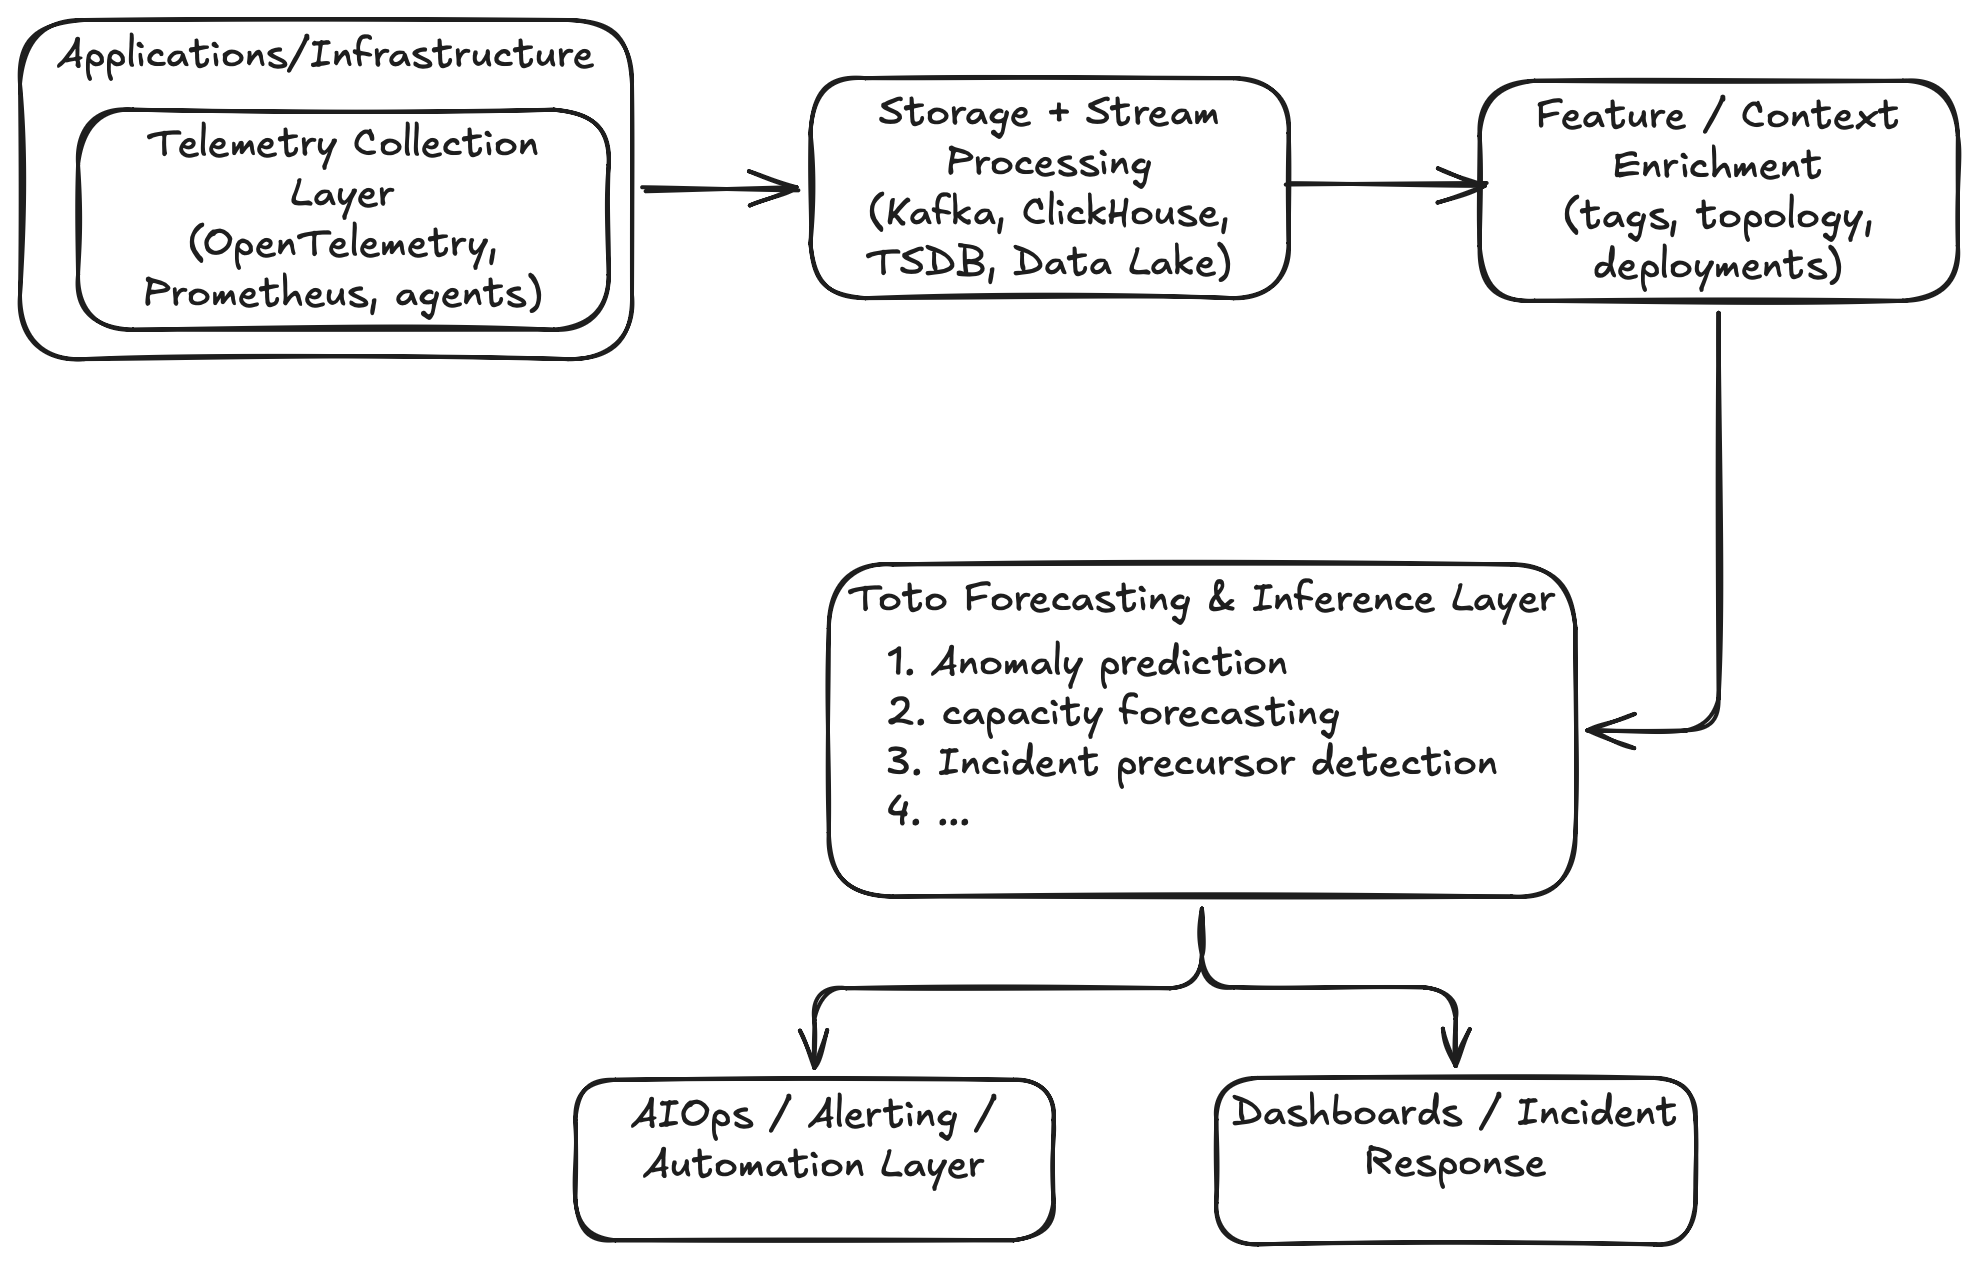
It is important to understand that Toto 2.0 is not a silver bullet. The model is not designed for tasks such as root-cause analysis or causal reasoning. Instead, it is intended to complement existing observability solutions. In a production environment, Toto would typically work alongside:
tracing systems,
topology graphs,
alert correlation engines,
incident management systems.
A modern observability platform could integrate Toto across multiple architectural layers, as shown below:
Use cases.
Let’s go through a few use cases where Toto could be a good fit. As a quick disclaimer, I do not have hands-on experience working in a modern operations team, so these use cases are based on my own perspective and understanding.
1. Predictive anomaly detection.
This is the most obvious use case. On the traditional monitoring:
CPU > 90% → alertIn Toto-style monitoring, it should be something like these:
CPU pattern predicts saturation in 15 minutesSo, instead of traditional threshold-based alerts:
the model learns normal temporal behavior,
forecasts future states.
Incident precursor detection
This is where the Toto foundation model becomes especially powerful. In many cases, system outages are preceded by early warning signals or anomalous behavior patterns:
queue buildup,
retry growth,
cache degradation,
network jitter,
thread pool saturation.
Toto can learn multivariate temporal correlations such as
Pattern A + Pattern B + Pattern C
→ often leads to incident type X
This enables:
earlier detection,
predictive incident management.
Capacity forecasting
Most often, observability platforms constantly store telemetries:
resource utilization,
request rates,
storage growth,
DB throughput.
Toto can use these telemetries to forecast:
cluster saturation,
storage exhaustion,
bandwidth limits,
database scaling needs.
For example,
Kafka retention storage will exhaust in 9 days.However, there are many additional use cases where Toto could provide significant value, such as intelligent alert correlation, root-cause assistance, and pattern similarity search.
For now, this overview should be enough. If you would like to explore the topic further, please refer to the official product documentation.
Hands on lab.
Toto 2.0 introduces several new features, including Zero-Shot Forecasting, High-Dimensional Support, and Probabilistic Predictions, among others. In this short tutorial, I will focus on Probabilistic Predictions, as this is one of the more practical and commonly applicable use cases for operational teams.
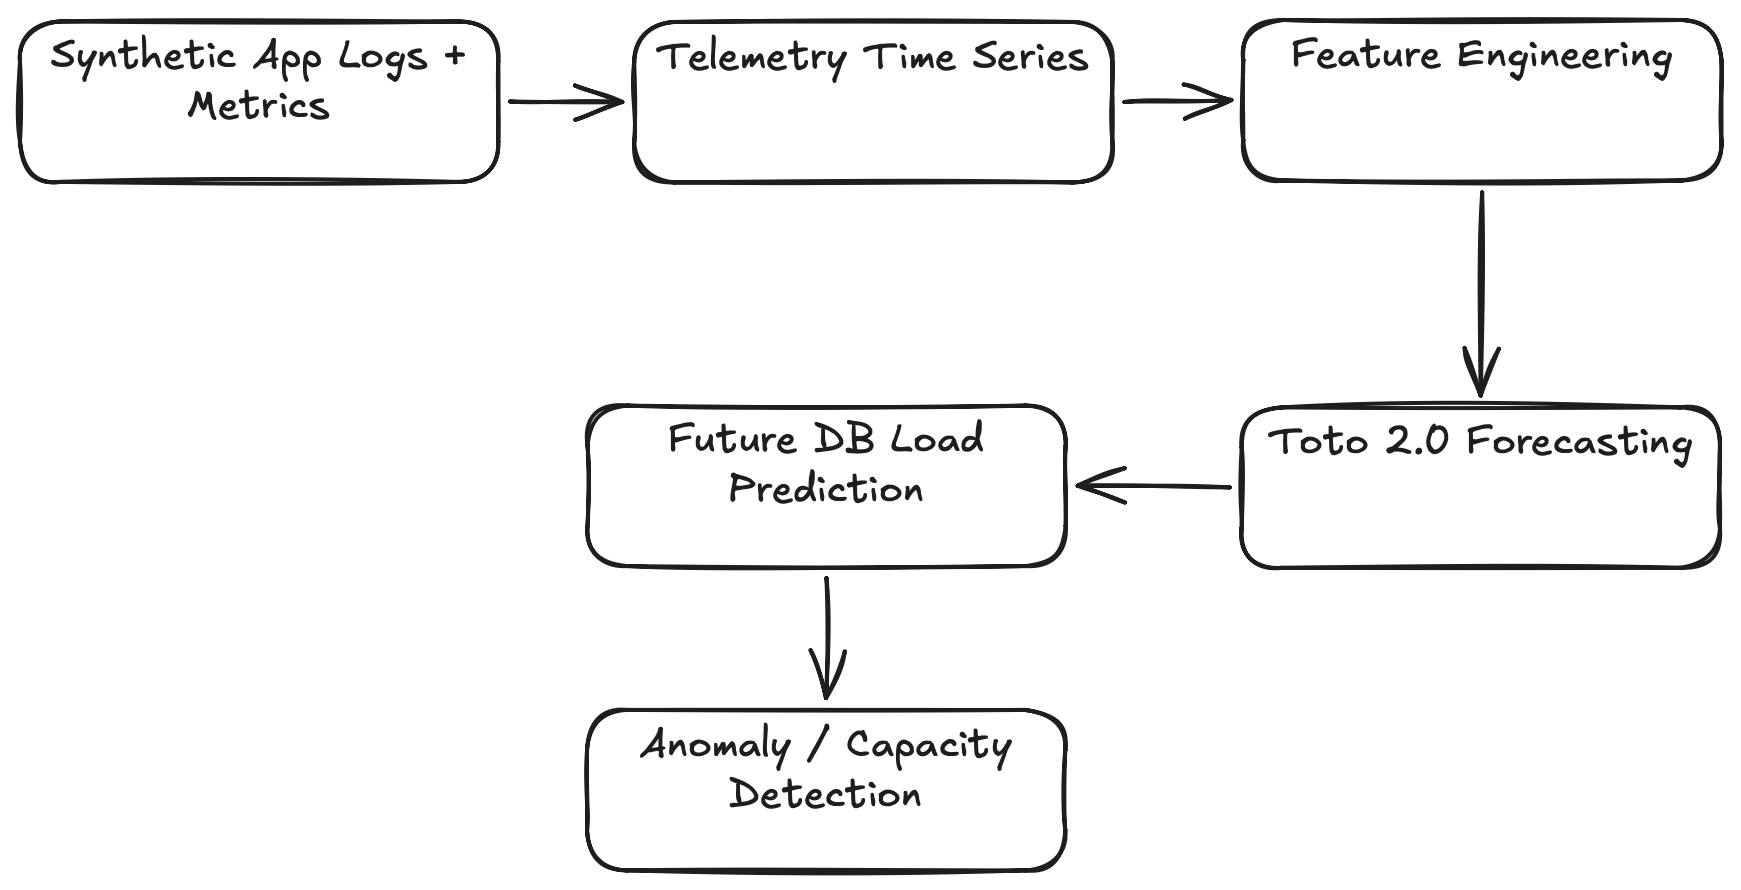
For a simple demonstration, I chose the following example:
Predict future database load using application telemetry logs and metrics.The example simulates:
PostgreSQL query throughput
active DB connections
API request spikes
slow queries
cache misses
Then Toto 2.0 forecasts future DB load. This is useful for:
proactive autoscaling,
saturation prediction,
SLA protection.
The steps of the demo are shown below:
Let's get started.
Step 1. Install Toto 2.0
I am using Google Colab to develop and run the application. You can either download the .ipynb file from the repository and run it directly, or create a new Colab project and copy the code snippets from this page.
Change the runtime type to T4 GPU Install Toto 2.0
!pip install -q "toto-2 @ git+https://github.com/DataDog/toto.git#subdirectory=toto2"
!pip install -q pandas matplotlib numpy
Step 2. Imports
import numpy as np
import pandas as pd
import torch
import matplotlib.pyplot as plt

from toto2 import Toto2Model
Step 3. Check Cudo
evice = "cuda" if torch.cuda.is_available() else "cpu"

print("Using device:", device)
If CUDA is enabled, you should see a similar output: "Using device: cuda"
Step 4. Generate realistic observability telemetry
This simulates:
business traffic cycles,
DB bottlenecks,
noisy production metrics.
np.random.seed(42)
# Must be divisible by 32
n_steps = 1536
t = np.arange(n_steps)
# Base database load
db_qps = (
300
+ 80 * np.sin(2 * np.pi * t / 144)
+ 40 * np.sin(2 * np.pi * t / 48)
)
# Add upward growth trend
db_qps += t * 0.25
# Add random noise
db_qps += np.random.normal(0, 20, n_steps)
# Add BIG overload spikes
for i in range(25):
spike_start = np.random.randint(0, n_steps - 30)
spike_size = np.random.randint(250, 500)
db_qps[spike_start:spike_start+30] += spike_size
df = pd.DataFrame({
"db_qps": db_qps
})
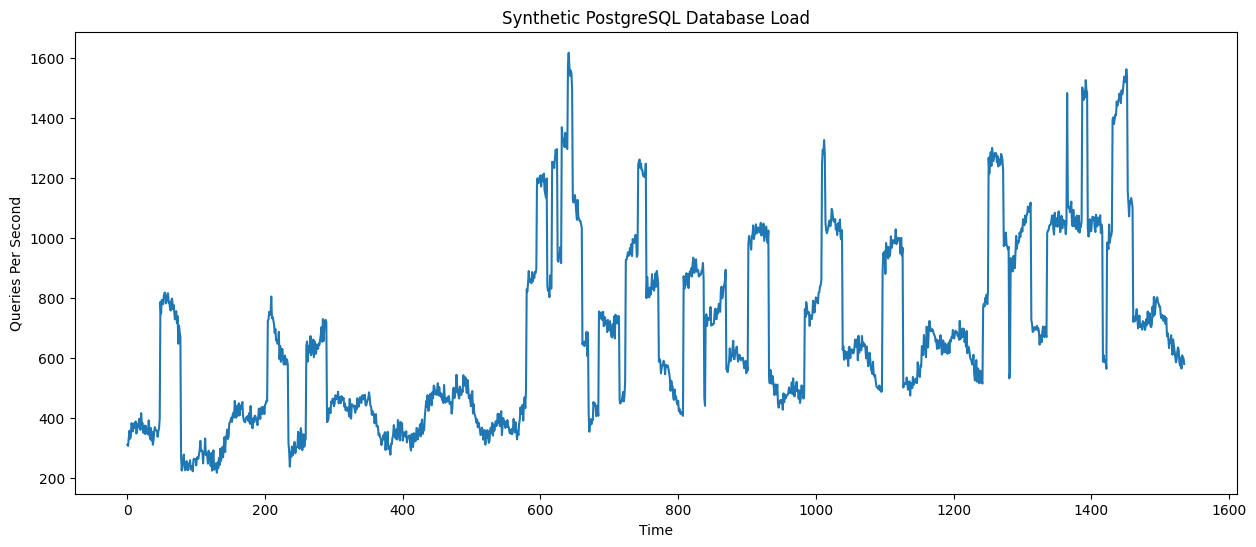
print(df.head())Step 5. Visualize observability metrics
plt.figure(figsize=(15,6))

plt.plot(df["db_qps"])

plt.title("Synthetic PostgreSQL Database Load")

plt.xlabel("Time")

plt.ylabel("Queries Per Second")

plt.show()
You should see a similar output:
Step 6. Prepare Toto input tensor
data = df["db_qps"].values.astype(np.float32)

mean = data.mean()
std = data.std()

data_norm = (data - mean) / std

print("Mean:", mean)
print("Std:", std)

tensor_data = torch.tensor(data_norm)

# Add variable dimension
tensor_data = tensor_data.unsqueeze(0)

# Add batch dimension
tensor_data = tensor_data.unsqueeze(0)

tensor_data = tensor_data.float()

tensor_data = tensor_data.to(device)

print("Tensor shape:", tensor_data.shape)
Step 7. Load Toto 2.0 model
model = Toto2Model.from_pretrained(
    "Datadog/Toto-2.0-22m"
)

model = model.to(device)

model.eval()
Toto 2.0 supports models from:
4M
22M
313M
1B
2.5B parameters.
I am using the 22M parameter model, which fits within the 16 GB memory available in Google Colab.
Step 8. Forecast future database load
eries_ids = torch.tensor([[0]]).to(device)

target_mask = torch.ones_like(
    tensor_data,
    dtype=torch.bool
).to(device)

inputs = {
    "target": tensor_data,
    "series_ids": series_ids,
    "target_mask": target_mask
}

prediction_length = 120

with torch.no_grad():

    forecast = model.forecast(
        inputs,
        horizon=prediction_length
    )

forecast_np = forecast.cpu().numpy()

print("Forecast shape:", forecast_np.shape)

THRESHOLD = 500

future_risk = predicted_db_qps > THRESHOLD

if future_risk.any():

    risk_points = np.where(future_risk)[0]

    print("⚠️ Predicted database overload detected")

    print(
        f"First overload predicted in "
        f"{risk_points[0]} future timesteps"
    )

else:

    print("✅ No overload predicted")
Here, you should see the following message:
"Predicted database overload detected. First overload predicted in 0 future timesteps."This indicates that Toto 2.0 predicts the database is already entering an overload state at the very beginning of the forecasting horizon.
Step 9. Visualize again
historical_db_qps = df["db_qps"].values

plt.figure(figsize=(16,6))

plt.plot(
    range(len(historical_db_qps)),
    historical_db_qps,
    label="Historical DB Load"
)

plt.plot(
    range(
        len(historical_db_qps),
        len(historical_db_qps) + prediction_length
    ),
    predicted_db_qps,
    label="Forecasted DB Load"
)

plt.axvline(
    x=len(historical_db_qps),
    linestyle="--"
)

# Overload threshold
plt.axhline(
    y=THRESHOLD,
    color='red',
    linestyle='--',
    label='Overload Threshold'
)

plt.legend()

plt.title("Toto2 Forecast — PostgreSQL Database Load")

plt.show()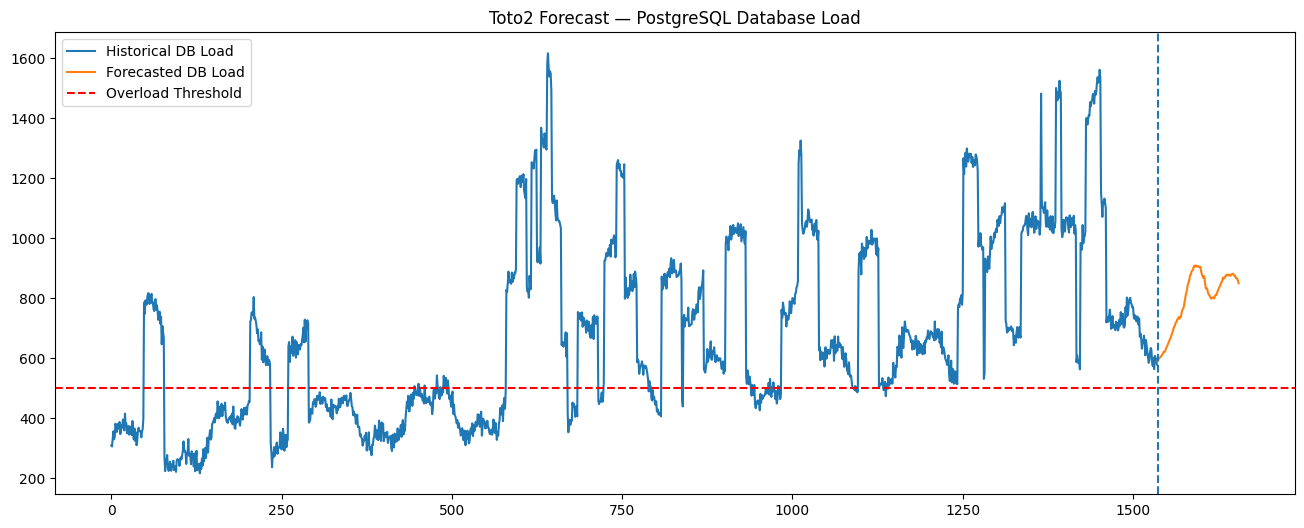
Actually, what happened internally? We configured
THRESHOLD = 500Then Toto2 predicted something like Predicted DB QPS =
495
510
517
Since: 517>500, the system immediately triggered overload detection.
Conceptually, Toto2 is saying "Based on recent telemetry patterns, the database is expected to already be overloaded as soon as the forecast starts."
The demo is not perfect but demonstrate how predictive AIOps systems work.
Instead of:
CPU overloaded NOWToto2 try to detect:
CPU will overload soonThis forms the foundation of basic predictive monitoring. From here, you can continue exploring the other features and capabilities provided by Toto 2.0.